What Does a Neural Network Learn? Visualizing MNIST with Causal Index
knowledge-extract Live Demo →This is Chapter 1 of a two-part series on knowledge extraction from neural networks. Live demo · Source on GitHub
The causal index is a method for understanding what a neural network has learned by measuring how strongly each input pixel influences each output class. For an MNIST digit classifier, this produces heat maps that visually reveal which pixel regions the network relies on for each digit — a form of neural network interpretability implemented here in pure JavaScript, running in the browser.
Background
This project was inspired by an online demo by Hubert Eichner — a neural network for handwritten digit recognition running entirely in the browser. The network was trained on the MNIST dataset in MATLAB, then exported to JavaScript. Combined with a drawing tool, it lets users write digits on screen and get instant predictions.
The model achieves a recognition error of just 1.92% (9,808 out of 10,000 digits classified correctly), which is a solid result even among other MNIST benchmarks. Great work and a beautiful presentation — but can we go further?
The Question: What Has the Network Learned?
A trained model can classify digits, but there’s growing interest in understanding how it makes decisions. Researchers often want to peek inside the “black box” and extract interpretable rules or measure how each input contributes to the output.
Several approaches exist for this purpose, varying in complexity and assumptions about network structure. Two useful references:
- Barczys et al. — Rule extraction from neural networks
- Knowledge Extraction from Artificial Neural Network Models (ResearchGate)
In this chapter, we use one of the simplest: the causal index method.
Network Architecture
The network has a straightforward feed-forward structure:
- Input layer: 784 units (a 28 x 28 grayscale image, pixel values normalized to the range [-1, 1])
- Hidden layer: a set of hidden neurons with learned weights
- Output layer: 10 units, each representing the probability of a digit class (0 through 9)
The full network structure and weight values are available in net.js, extracted from the original demo page.
Computing the Causal Index
Since the architecture and weights are fully known, we can calculate a causal index for each input pixel relative to each output class. The causal index measures how strongly a given input pixel influences a particular output, summed across all paths through the hidden layer:
C_i = sum over j from 0 to h of (W_kj * W_ji)
Where:
- h is the number of hidden neurons
- W_kj is the weight from hidden neuron j to output neuron k
- W_ji is the weight from input pixel i to hidden neuron j
In JavaScript, this looks like:
function getInfluence(inputIndex, outIndex) {
  var sum = 0;
  for (var i = 0; i < w12.length; i++) {
    sum += w12[i][inputIndex] * w23[outIndex][i];
  }
  return sum;
}
Visualizing the Results
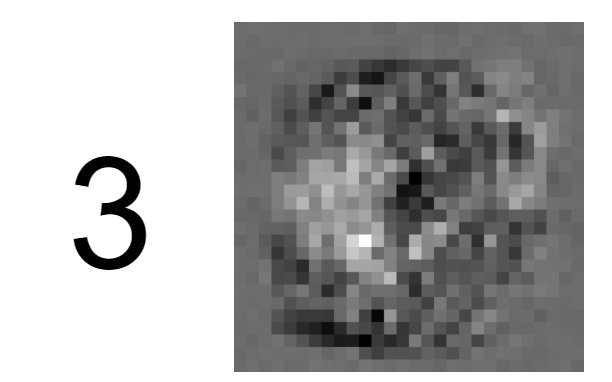
The final step is to create 10 “heat maps” — one for each digit class. Each heat map is a 28x28 image where the brightness of each pixel corresponds to its causal index value. Darker pixels have more influence on the network’s prediction for that digit.
The visualization is rendered on HTML canvas elements using a draw function that maps each pixel’s causal index to a grayscale color value.
What the Heat Maps Reveal
The results are striking: the heat maps closely resemble the actual digit shapes. This makes intuitive sense — pixels in the regions where a digit is typically drawn should have the strongest influence on recognizing that digit.
You can see all 10 heat maps generated live in the interactive demo.
What’s Next
The causal index method is fast and intuitive, and it works well for simple feed-forward networks with known structure. However, more complex architectures (or true “black box” models) require different techniques — for instance, iteratively adapting an input image to maximize a particular output class, similar to the approach used in DeepDream.
That’s exactly what we explore in Chapter 2.